Data Crosstab
Data Crosstab
A data crosstab is a two-way table composed of columns and rows, also known as a pivot table or multidimensional table. Through crosstab analysis, users can conduct in-depth analysis of questionnaire data from multiple dimensions (such as age, gender, region, etc.), helping users discover hidden correlations in the data, such as differences in responses to a particular question among different groups. Data crosstab analysis presents complex data relationships in an intuitive tabular format, revealing relationships between different variables while making it easier for users to quickly understand. Its greatest advantage is the ability to construct, summarize, and display large amounts of data. Crosstabs can display column subtotals as well as totals for columns, rows, or entire measures.
Crosstab Table
A cross-tabulation table is used to categorize data for cross-tabulation. For example, data from a restaurant satisfaction survey can be divided into service satisfaction, environment satisfaction, and dining satisfaction workspaces. Each cross-tabulation table only contains the data table corresponding to its respective question, facilitating quick location and focus on the required data charts.
- Create Crosstab: Click to create a cross-tabulation table, enter a name, and click OK to save the current data within the table.
- Switch Crosstab: Select a name from the drop-down menu to switch between cross-tabulation tables.
- Manage Crosstabs: Click to display a pop-up window showing the names of all current cross-tabulation tables.
- Rename: Click the edit button, enter a new name, and confirm.
- Delete: Click the delete button to delete unused cross-tabulation tables. Currently used cross-tabulation tables cannot be deleted.
Create Cross-tabulation Table
Once a questionnaire has been published and responses have been collected, you can perform cross-analysis on the questionnaire data. The main operations include:
- Setting Table Headers and Questions
- Selecting Statistical Indicators
Setting Table Headers and Questions
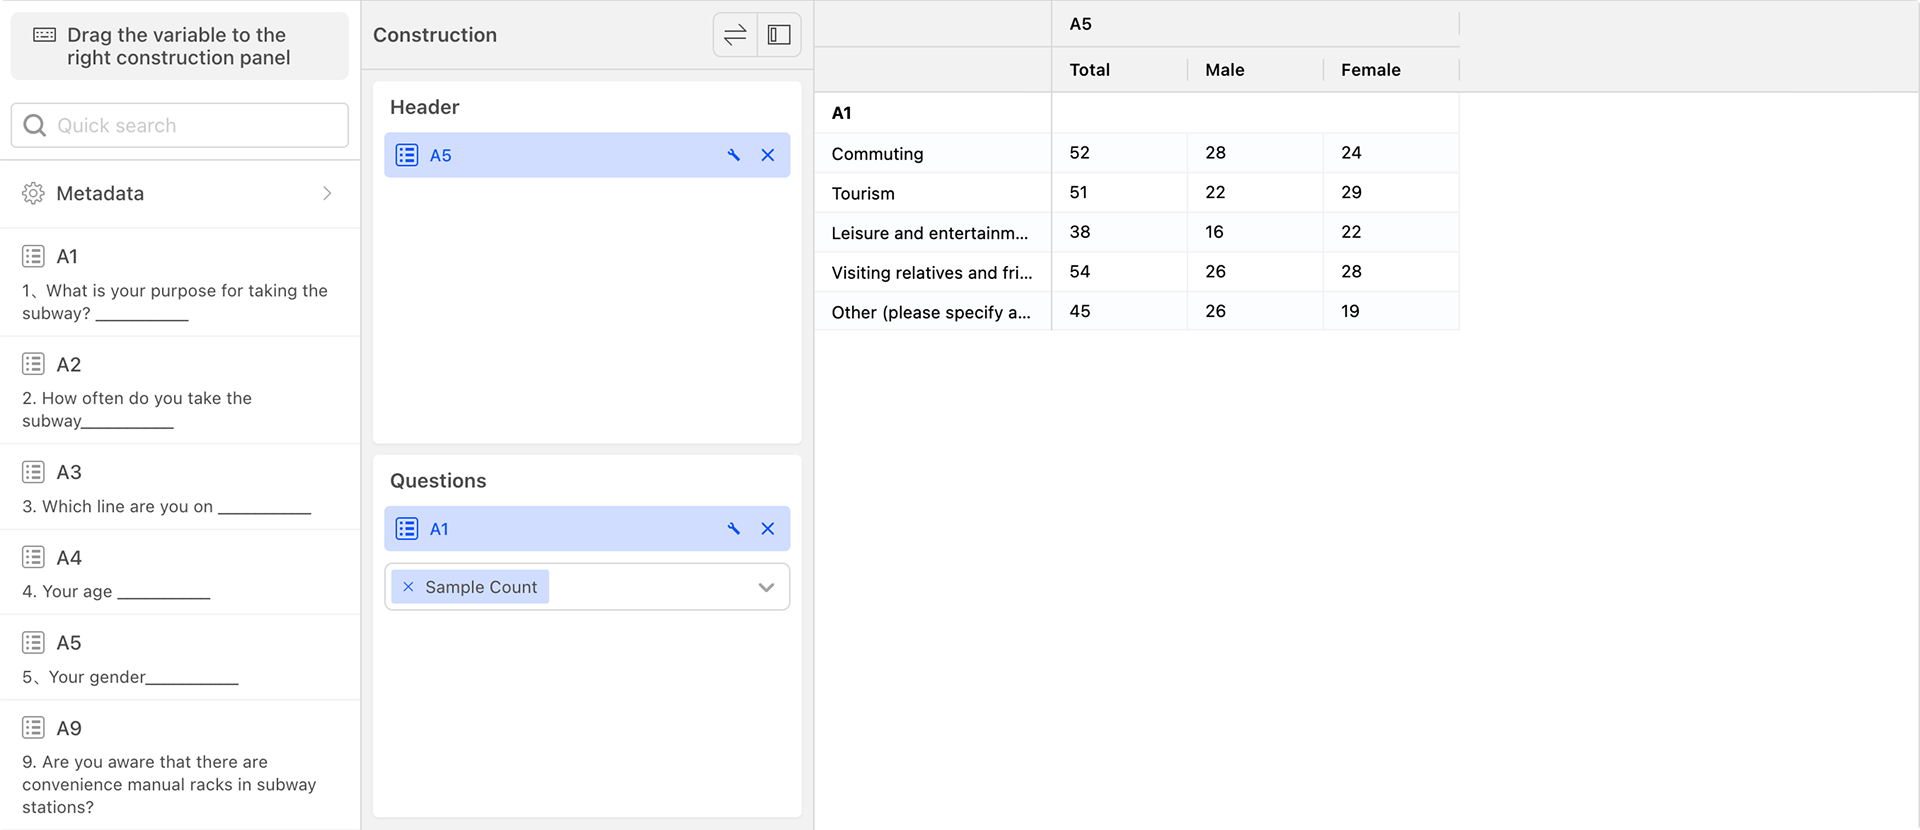
The data cross-tabulation page is mainly divided into three regions: left, center, and right. By default, when you enter the page, there are no cross-tabulation tables, as shown in the image below:

- Questionnaire Question List: A list of current questionnaire questions. You can drag questions from this list to the table header or question area. By entering content in the search box above, you can quickly search for matching questionnaire questions.
- Table Header: The composition of the table header for the cross-tabulation table.
- Questions: The composition of the questions for the cross-tabulation table.
To construct a cross-tabulation table, simply drag questions to the table header or question area.
Choosing Statistical Indicators
The default cross-tabulation indicator is sample count, but you can select the desired indicators from the dropdown list. Multiple indicators can be selected, and the cross-tabulation table will be calculated in real-time after selection.
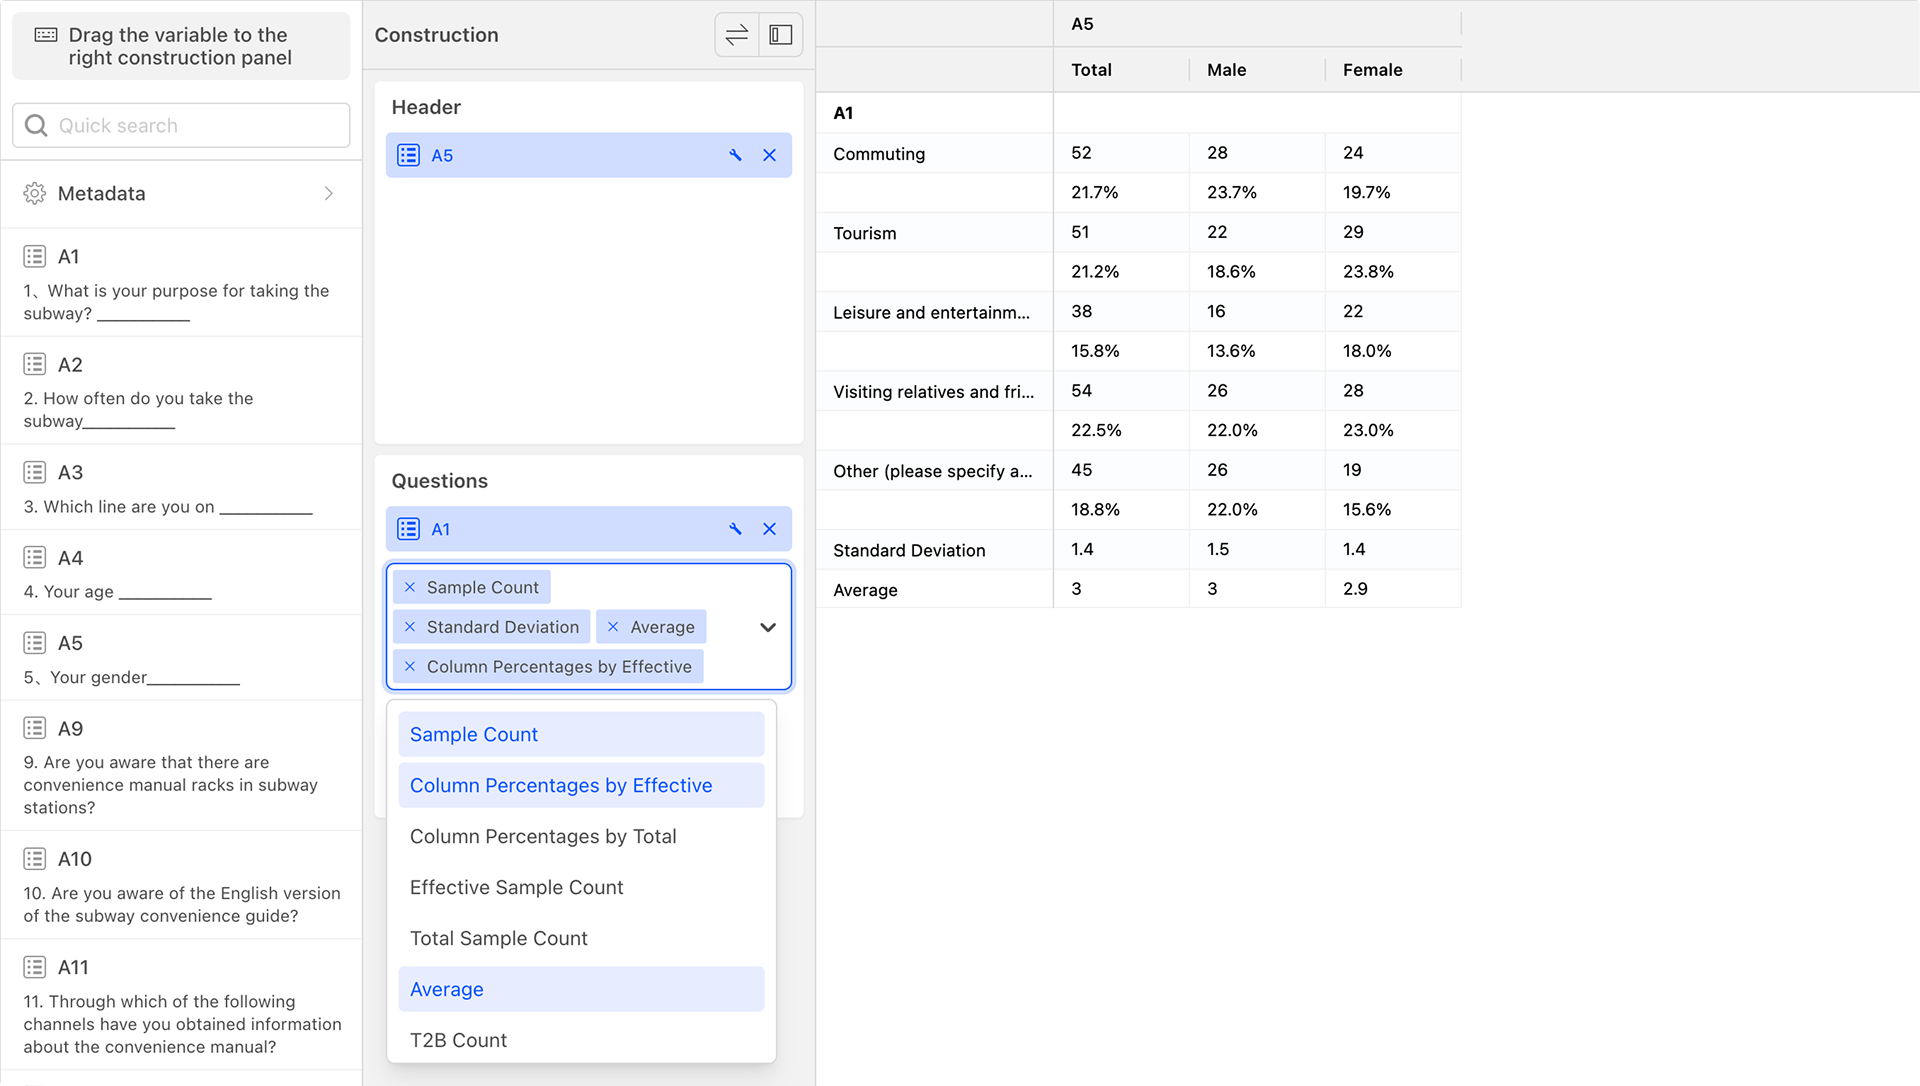
The types of cross-tabulation statistical indicators supported by the system include:
-
Sample Count: The number of samples.
-
Column Percentages by Effective Samples: The percentage of sample count over the valid sample count.
-
Column Percentages by Total Samples: The percentage of sample count over the total sample count.
-
Effective Sample Count: The total number of samples contributing to both a column and a row cross-dimension. In Qiaosi Questionnaire, if row questions have optional answers, the valid sample count may be smaller than the total sample count.
-
Total Sample Count: The total number of samples contributing to a column dimension.
-
Average: The average value of scores provided by a group of samples, calculated as the total score divided by the number of samples.
-
T2B Count: For scoring questions (numerical dimensions), T2B calculates the total number of samples with the top two scores.
-
T2B Percentages by Effective Samples: T2B count divided by the valid sample count.
-
T2B Percentages by Total Samples: T2B count divided by the total sample count.
-
T3B Count: For scoring questions (numerical dimensions), T3B calculates the total number of samples with the top three scores.
-
T3B Percentages by Effective Samples: T3B count divided by the valid sample count.
-
T3B Percentages by Total Samples: T3B count divided by the total sample count.
-
B2B Count: For scoring questions (numerical dimensions), B2B calculates the total number of samples with the bottom two scores.
-
B2B Percentages by Effective Samples: B2B count divided by the valid sample count.
-
B2B Percentage by Total Sampless: B2B count divided by the total sample count.
-
B3B Count: For scoring questions (numerical dimensions), B3B calculates the total number of samples with the bottom three scores.
-
B3B Percentages by Effective Samples: B3B count divided by the valid sample count.
-
B3B Percentages by Total Samples: B3B count divided by the total sample count.
-
NPS Count: For scoring questions with a score range of 0-10, NPS calculates the difference between the number of samples with the top two scores (9-10) and the number of samples with the bottom seven scores (0-6).
-
NPS Percentages by Effective Samples: NPS count divided by the valid sample count.
-
NPS Percentages by Total Sampless: NPS count divided by the total sample count.
-
Median: The median value of scores provided by a group of samples, equivalent to the 50th percentile.
-
Standard Deviation: The arithmetic square root of variance. Standard deviation can be calculated as either population standard deviation or sample standard deviation, and the cross-tabulation table uses sample standard deviation.
-
Standard Error: Standard deviation divided by the square root of the number of samples.
-
Variance: The average of the squared differences between each sample value and the mean of all sample values.
-
Overall Stat Tests: Calculates the chi-square test based on valid samples, resulting in four values**: chi-square, degrees of freedom, P-value, and significant correlation.
Cross-tabulation Settings and Operations
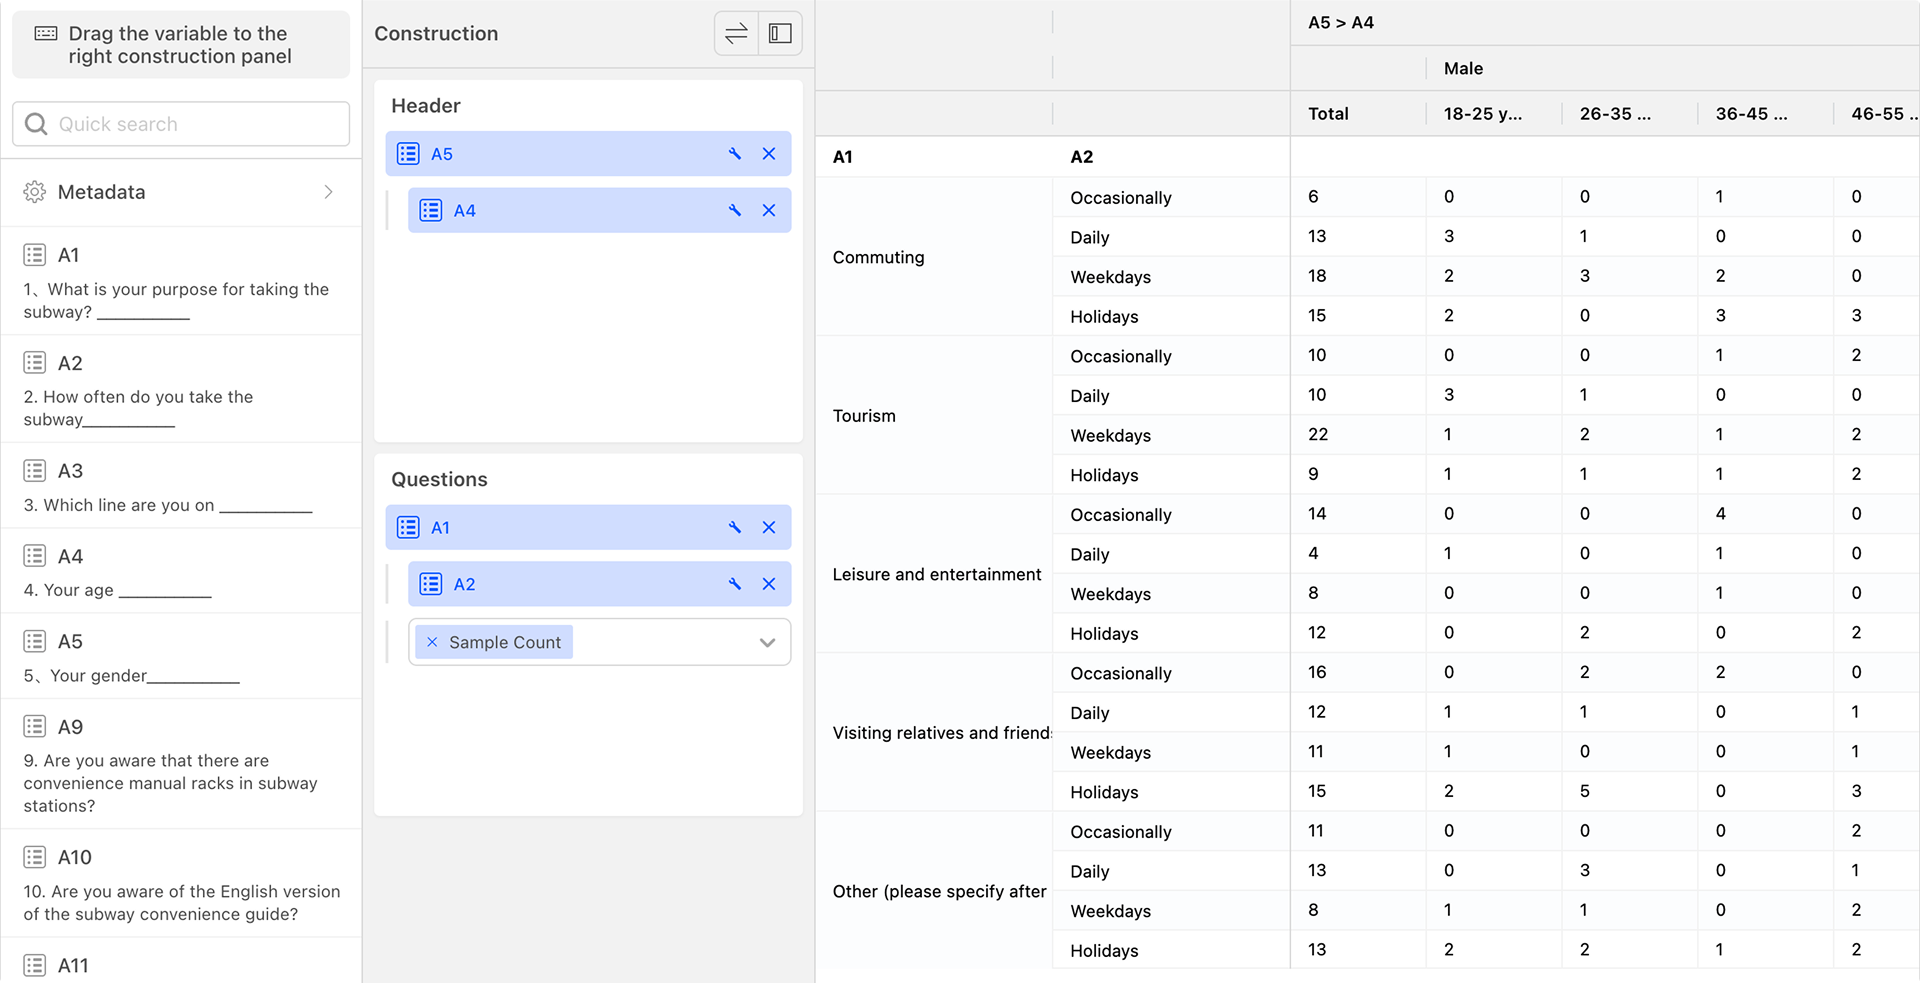
Multiple questions can be placed in the table header or question area.
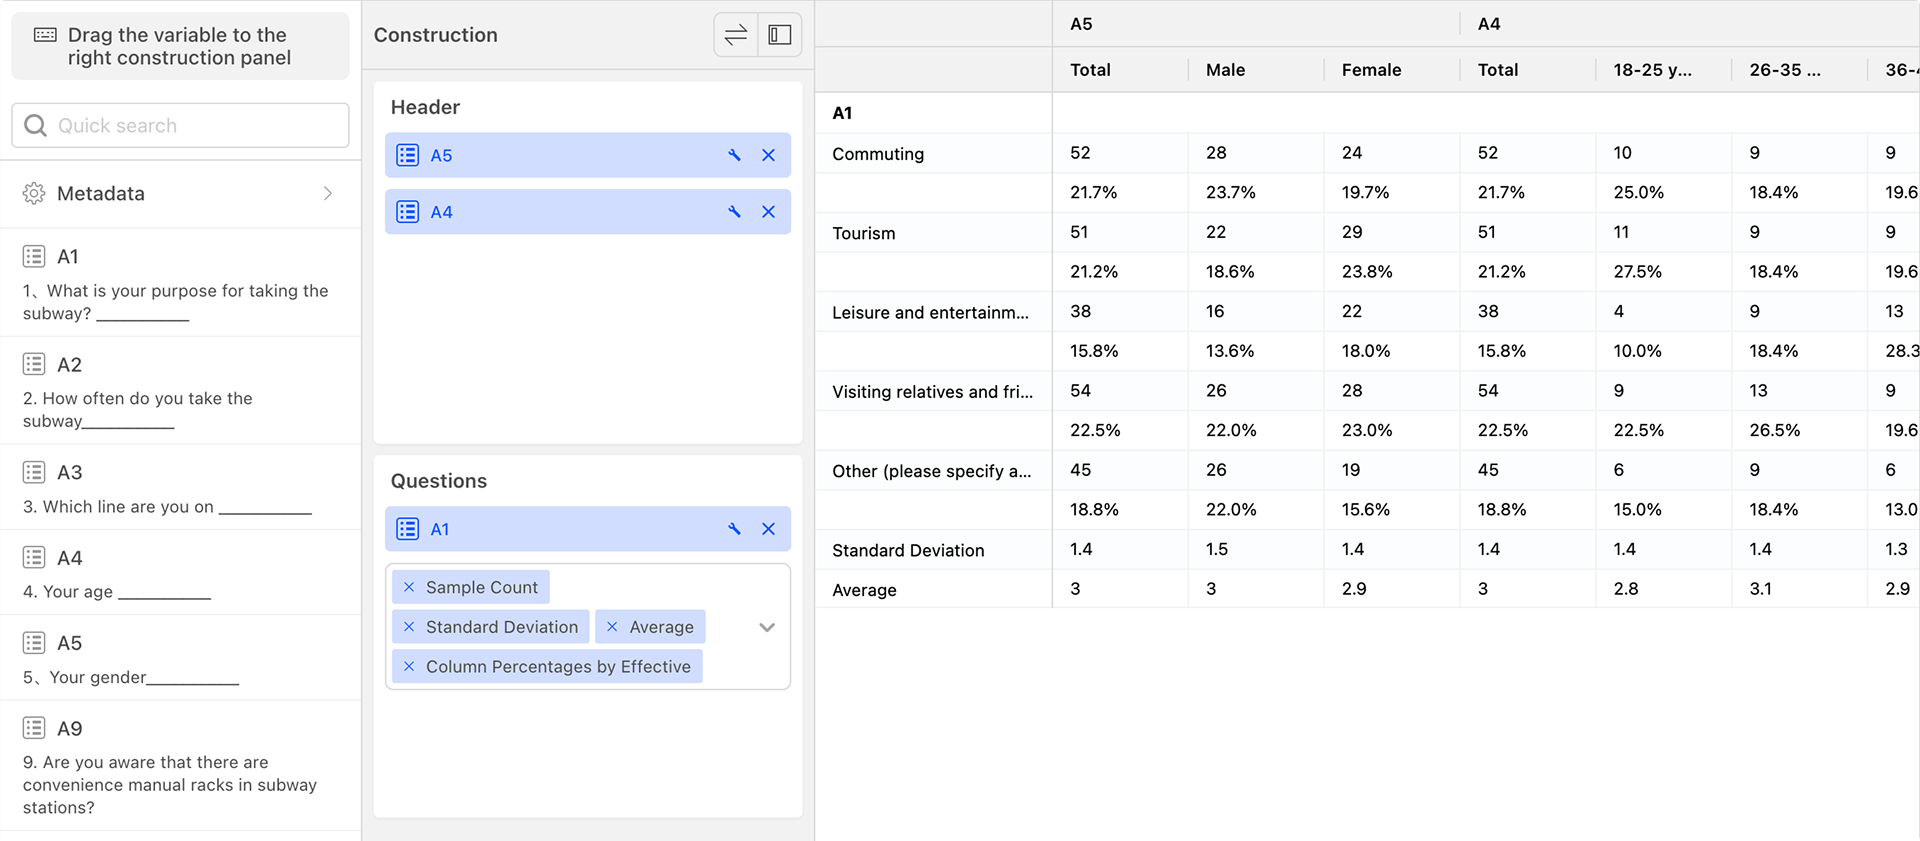
Multiple questions can be crossed within the table header or question area.
Filter
The filter in the data cross-tabulation toolbar affects all data and serves as a global data filter. The functionality of the global data filter is identical to that of the filter in the data table.
Export
Export Cross-tabulation Table
The export function in the data cross-tabulation card allows you to export data from the current or other cross-tabulations into an Excel format file. 
Each cross-tabulation data set as a separate sheet within the Excel file. 
Managing Exported Cross-tabulation Tables
Exporting a cross-tabulation table generates a file in the cloud. After clicking on "Manage Exported Cross-tabulation Tables", a pop-up dialog box will display all exported cross-tabulation table files. You can select a file and click "Download" to retrieve the cross-tabulation table file from the cloud. Alternatively, click "Delete" to remove the file from the cloud. 
Settings
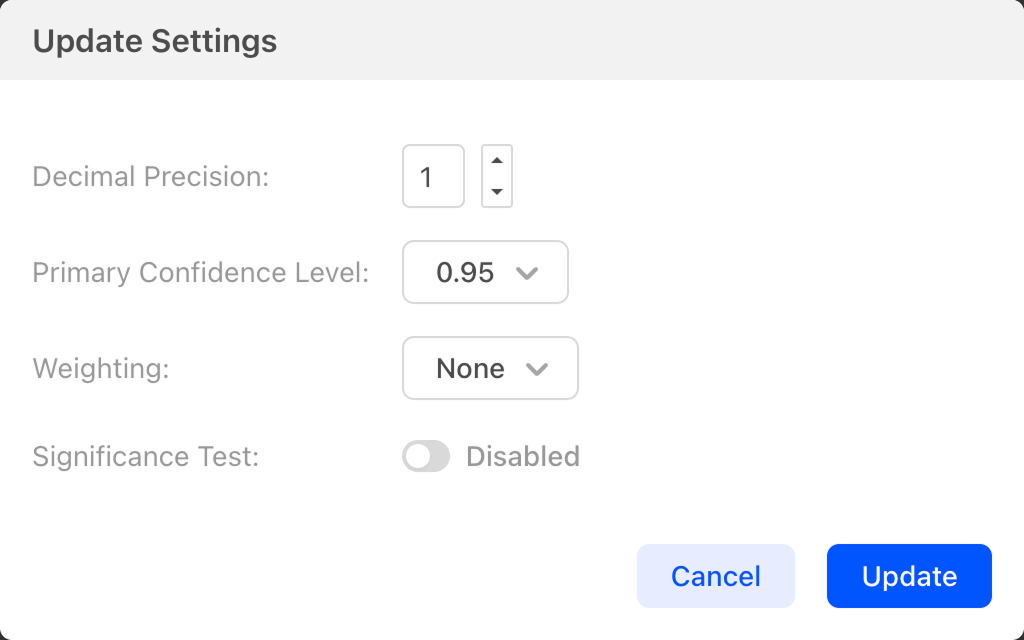
- Decimal Precision: Set the number of decimal places for percentages in the cross-tabulation table.
- Primary Confidence Level: Set the value for the confidence interval.
- Weighting: Set the weights in the cross-tabulation table.
- Significance Test: When enabled, significance levels will be indicated in the cross-tabulation table. Calculates whether there are significant differences between columns based on column percentages (all samples) using the Z-Test algorithm.